.png)
Data-Driven Success: Visualizing Key Achievements and Milestones
Strategic Planning and Leadership, driving growth through Process Efficiency, Continuous Improvement, Regulatory Compliance, Business Continuity, and Capacity Expansion.

Strategic Planning and Leadership, driving growth through Process Efficiency, Continuous Improvement, Regulatory Compliance, Business Continuity, and Capacity Expansion.
I am a dynamic leader specializing in aseptic manufacturing of sterile injectables, driving growth through process efficiency, continuous improvement, regulatory compliance, business continuity, and capacity expansion, all built on relationships, trust, partnership, collaboration, and workplace culture.
It is the leader’s responsibility, to build relationships and to improve the workplace culture. While continued growth is expected, the degree of growth is dependent on the strength of relationships and workplace culture. Essentially, our ability and extent we can “drive growth” comes down to timing.
In my experience, when we intentionally commit to developing relationships built on trust, partnership, and collaboration, a positive workplace culture naturally follows. In such an environment, those closest to their processes willingly offer recommendations for improvement and play a crucial role in driving departmental initiatives. This collective effort fosters organizational growth and excellence.
I have demonstrated that I can build relationships resulting in trust, partnership and collaboration and positive workplace culture. This has allowed the success of strategic initiatives reducing production timelines, increased operational output, and ensured regulatory compliance.
Through leadership in cross-functional team development and innovation, I have led significant cost savings and business continuity efforts. My accomplishments highlight my ability to implement data-driven solutions, to streamline operations and enhance work force engagement, positioning the organizations I work with for sustainable growth.
Below are a select few accomplishments, each accompanied by charts / graphs to visualize the data. For a comprehensive overview of my full achievement history, please visit the Accomplishments History page by clicking Here:
Click to Learn MoreImplemented and championed Six Sigma program across multiple sites, leading diverse project teams to improve fill-to-release metric by focusing on yield, accountability, fill volume limits, right-first-time practices, QA final batch record review to improve ≤ 30-day lot release & distribution. Successfully reduced fill-to-release metric from 54 days to 26 days, achieving a 50% reduction in time and generating hard savings of $1.7 million over 12 months measured by way of reduction of rejects, bulk discards and consequently improving filling yields.
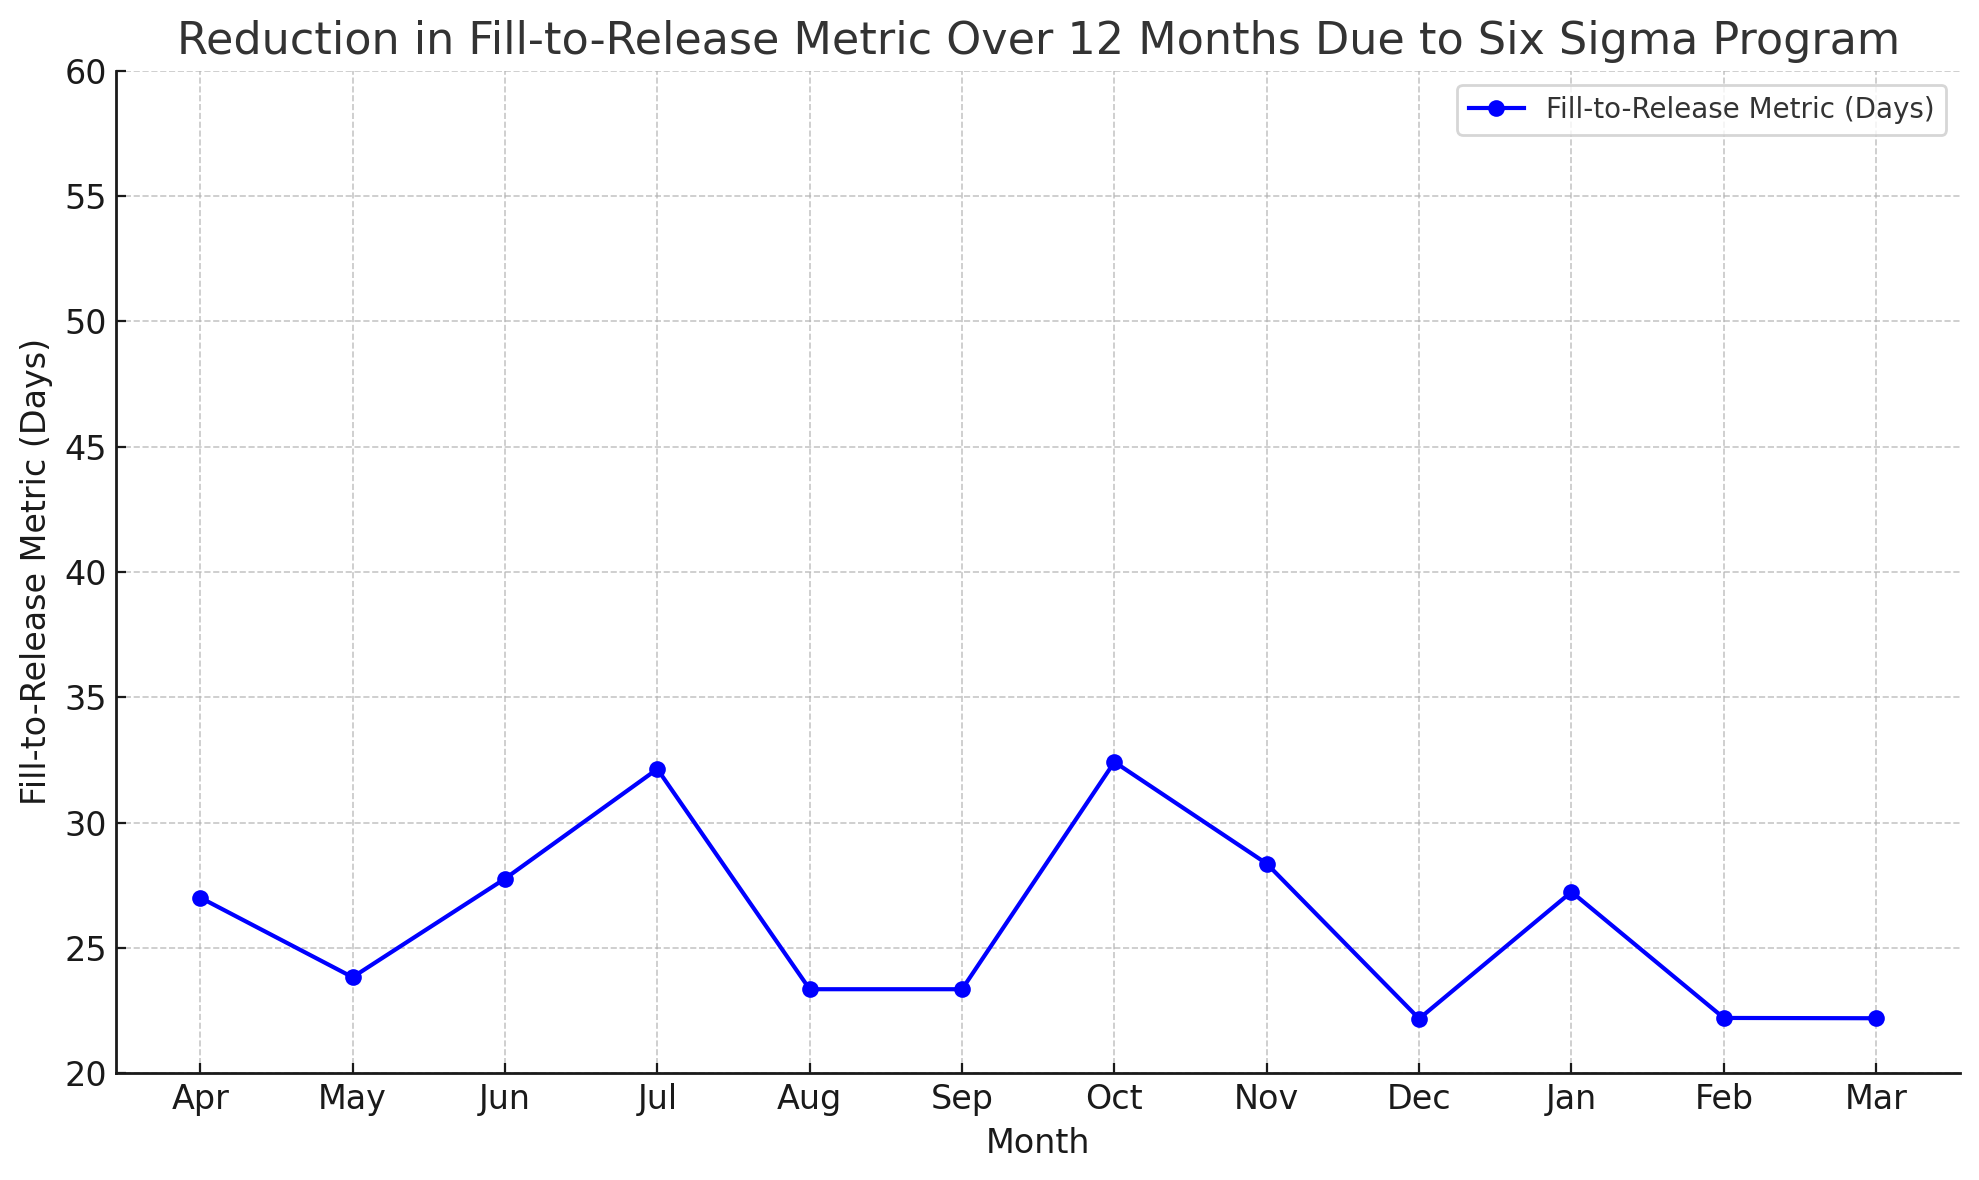
Chart Info:
This chart displays the reduction in fill-to-release days from 54 days to 26 days, achieving a 50% reduction. It also highlights the cost savings of $1.7 million generated over 12 months.
Spearheaded incentivized overtime plan that included critical departments by boosting filling manufacturing capacity by an additional 44 product lots [373 to 417], which is +12%, generating an additional 44 product lots over a 12-month period, effectively meeting customer demand and adverting third-party penalties of 900K.
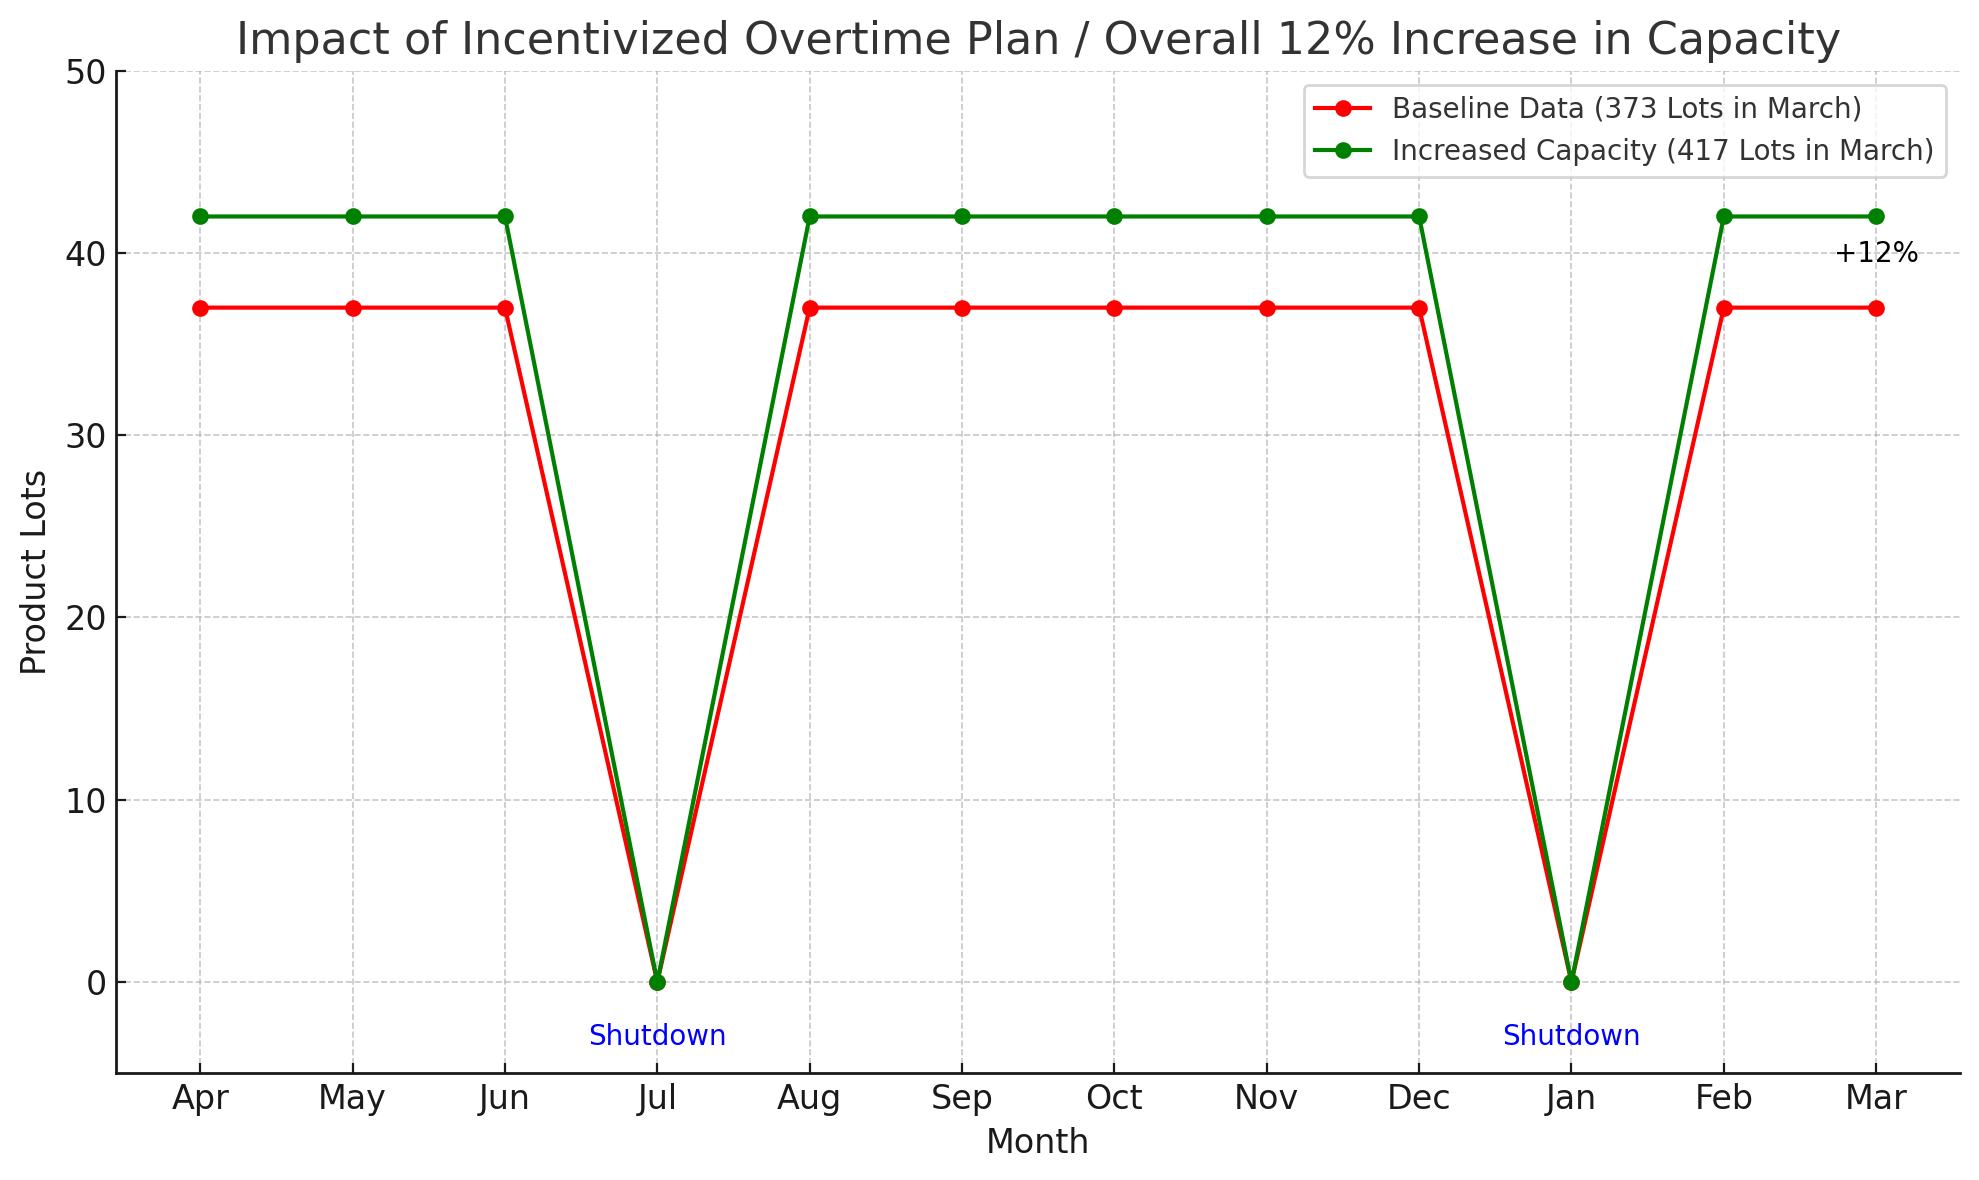
Chart Info:
This chart displays the reduction in fill-to-release days from 54 days to 26 days, achieving a 50% reduction. It also highlights the cost savings of $1.7 million generated over 12 months.
Spearheaded the integration of two fully operational inspection and packaging lines ≤ 60 days, ensuring seamless departmental relocation and meeting aggressive timelines. This project included the integration of vial washing, inspection, labeling, serialization, and packaging processes, leading to a 20% average improvement in Overall Equipment Effectiveness (OEE) from 62% to ~82% for 300 product lots over the course of 12 months, while mitigating compliance risk.
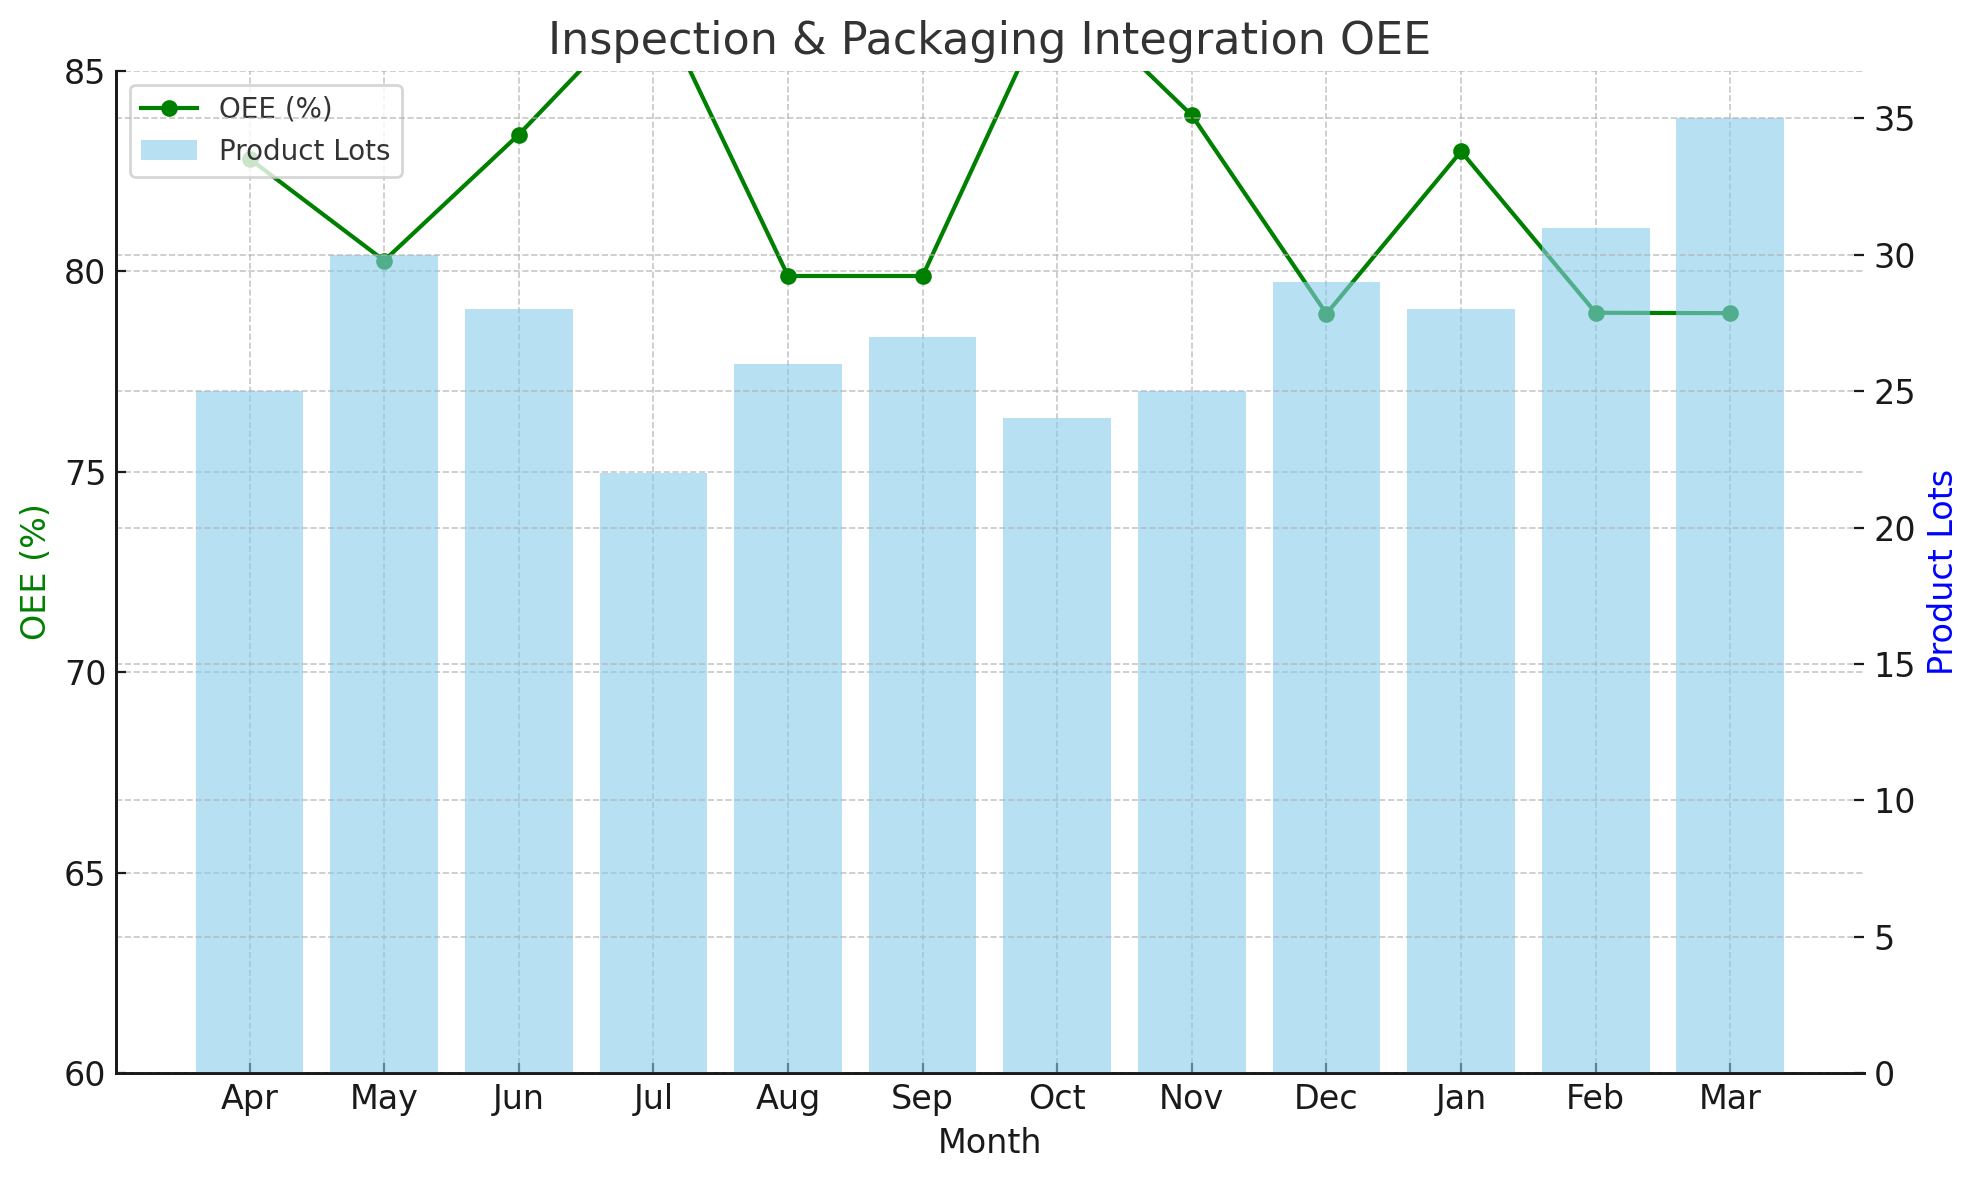
Chart Info:
This chart now reflects fluctuating OEE values with some below and some above 82%for each month, ensuring the average over 12 months is 82%. The line graph shows the month-to-month variation in OEE, while the bar graph represents the number of products lots processed each month.
This visual accurately communicates the variability in OEE improvement and the scale of product lots managed, emphasizing the overall average success of the integration project.
Implemented the Filling Lock-in Schedule process, ensuring a three-week forward-looking filling schedule to enhance readiness and minimize last-minute changes. Week #1 focuses on the readiness and release status of equipment, materials, batch records, protocols, and labor, reducing schedule changes from 3 out of 4 weeks (~75%) in each month to 1 out of 4 weeks (≤25%) improvement on average over a 12-month period. Fostered a culture where the locked-in schedule dictated manufacturing readiness, promoting efficiency, reducing confusion, and mitigating potential errors.

Chart Info:
Reduction in Schedule Changes Over 12 Months Due to Lock-In Filling Schedule: This line graph shows the schedule changes from April (Apr) to the following March (Mar). The specific data points ensure June (Jun) is at 50% and July (Jul) is at 25%. The average of these data points is 25%.
This visual effectively communicates the impact of the lock-in schedule on reducing schedule changes, enhancing readiness, and minimizing last-minute modifications, with realistic variability in the data points.
Identified and implemented a plan to qualify alternate suppliers for glass components, transitioning from Gerresheimer in Chicago Heights to Gerresheimer in India, as well as introducing a new glass supplier Bormioli located in Italy over a 12-month period. This strategic plan reduced component variability and improved filling yields by ~10%, resulting in a hard cost savings of $500,000 over the following 12 months.
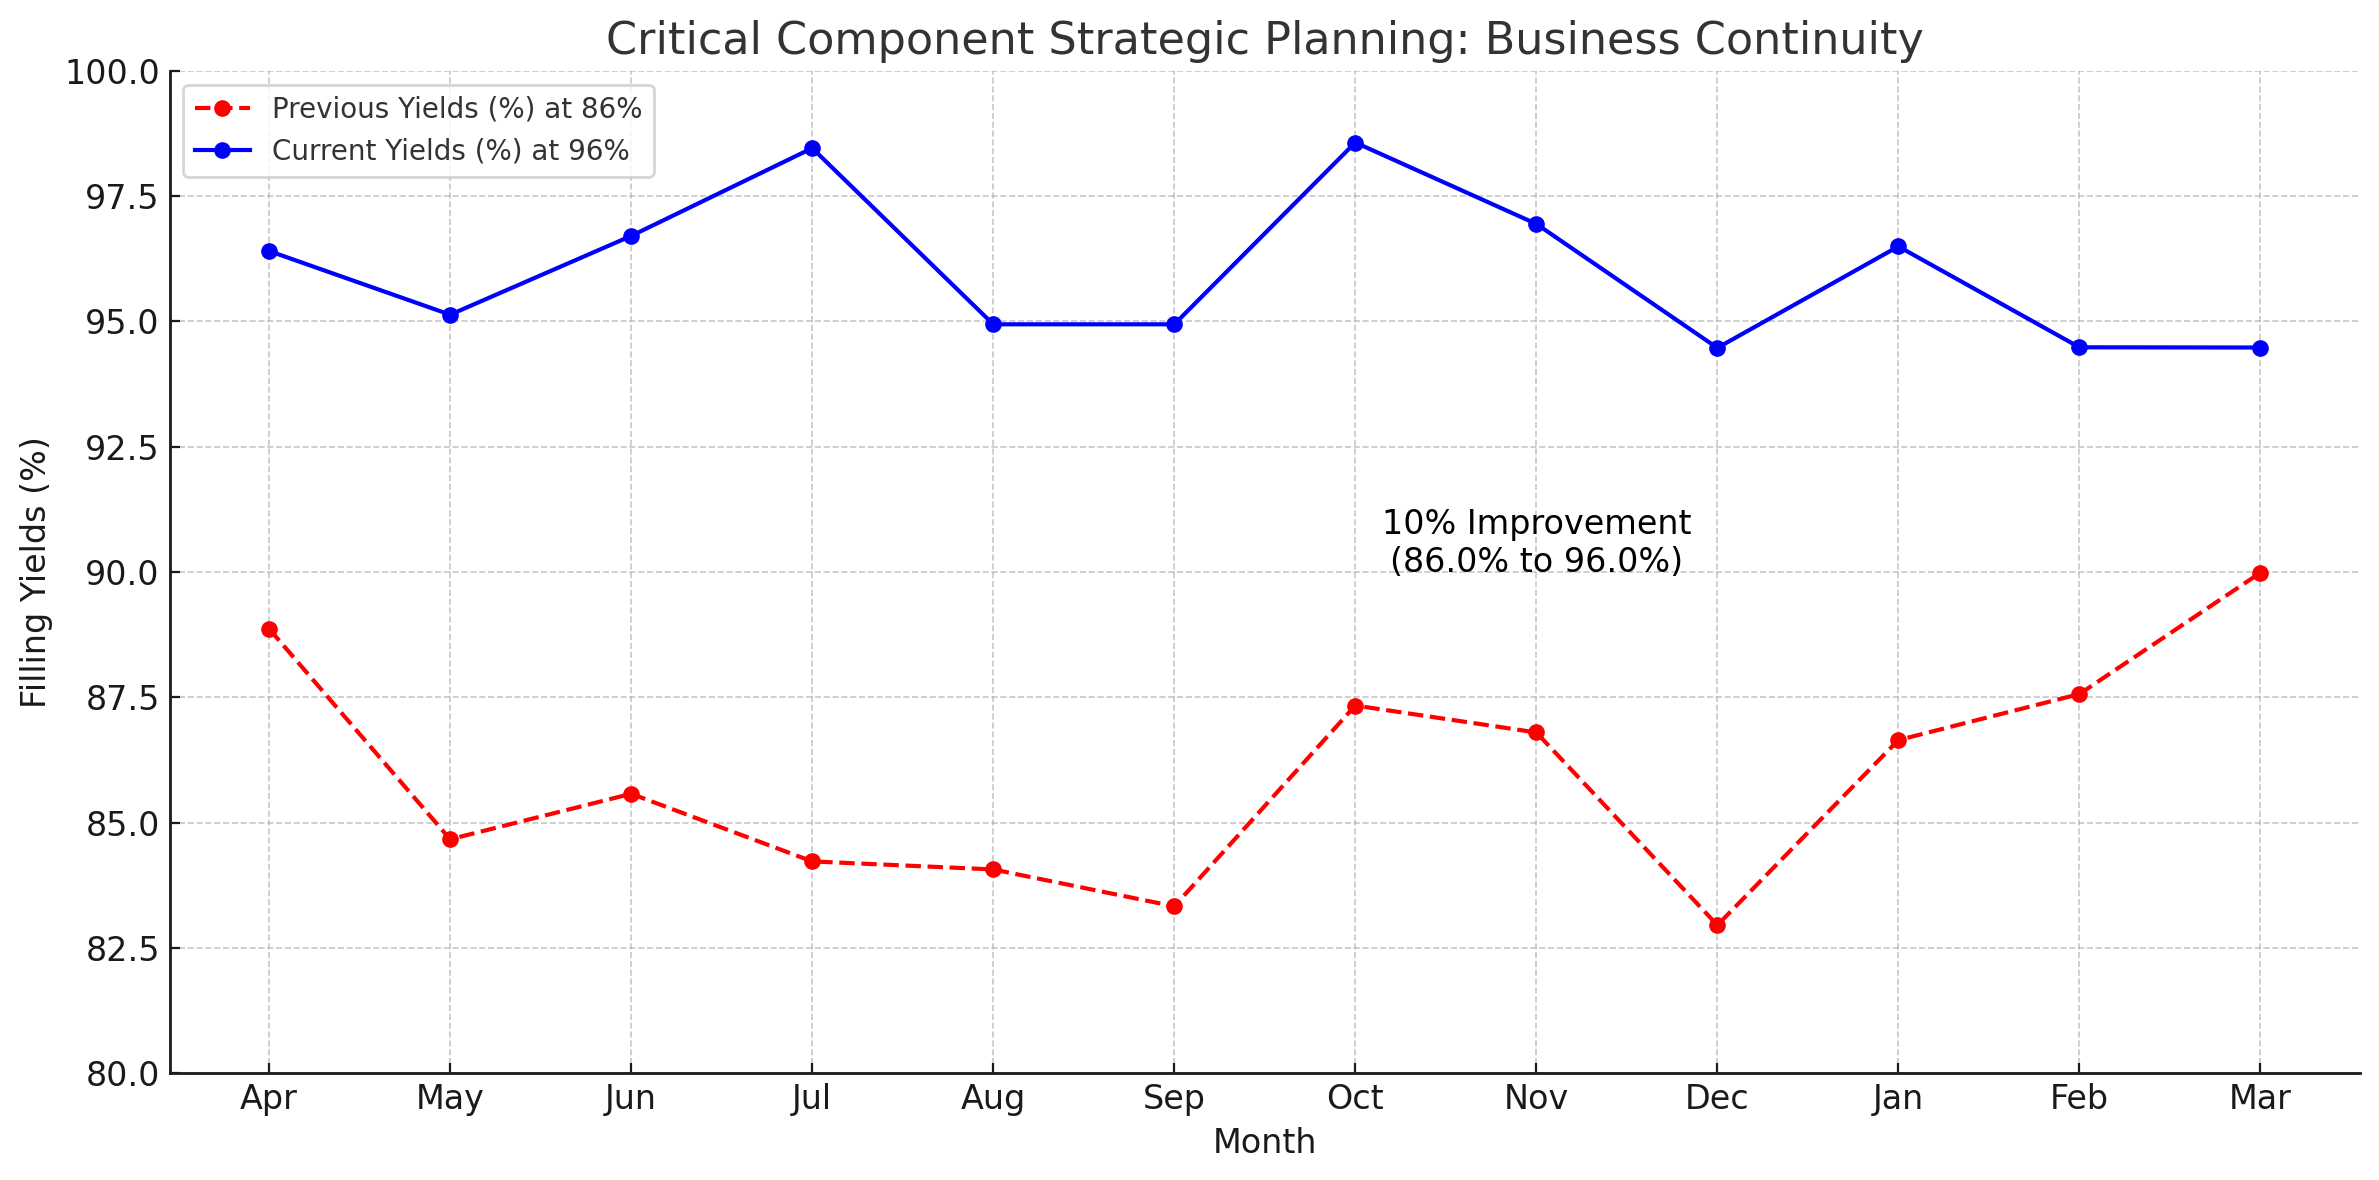
Chart Info:
Comparison of Filling Yields Over 12 Months:
This line graph shows the filling yields for the previous 12 months at 86% and the current 12 months with an average of 96%,from April (Apr) to the following March (Mar). The yields for both periods are variable but average to the specified values.
Indication of 10% Improvement:
The chart includes a text annotation highlighting the 10% improvement from the previous average yield of 86% to the current average yield of 96%. The arrow has been removed for better clarity.
This chart effectively illustrates the improvements in filling yields, demonstrating the strategic planning and business continuity efforts in reducing component variability and achieving significant cost savings.
Directed department heads to collaboratively establish internal compliance expectations to ensure on-time investigation closures, supporting on-time product release and meeting customer demand. Implemented a weekly compliance tracker for managers to monitor employee workloads and compliance adherence. Achieved an improvement in investigations closing within ≤ 30 days from 72% to 94% over a 12-month period.
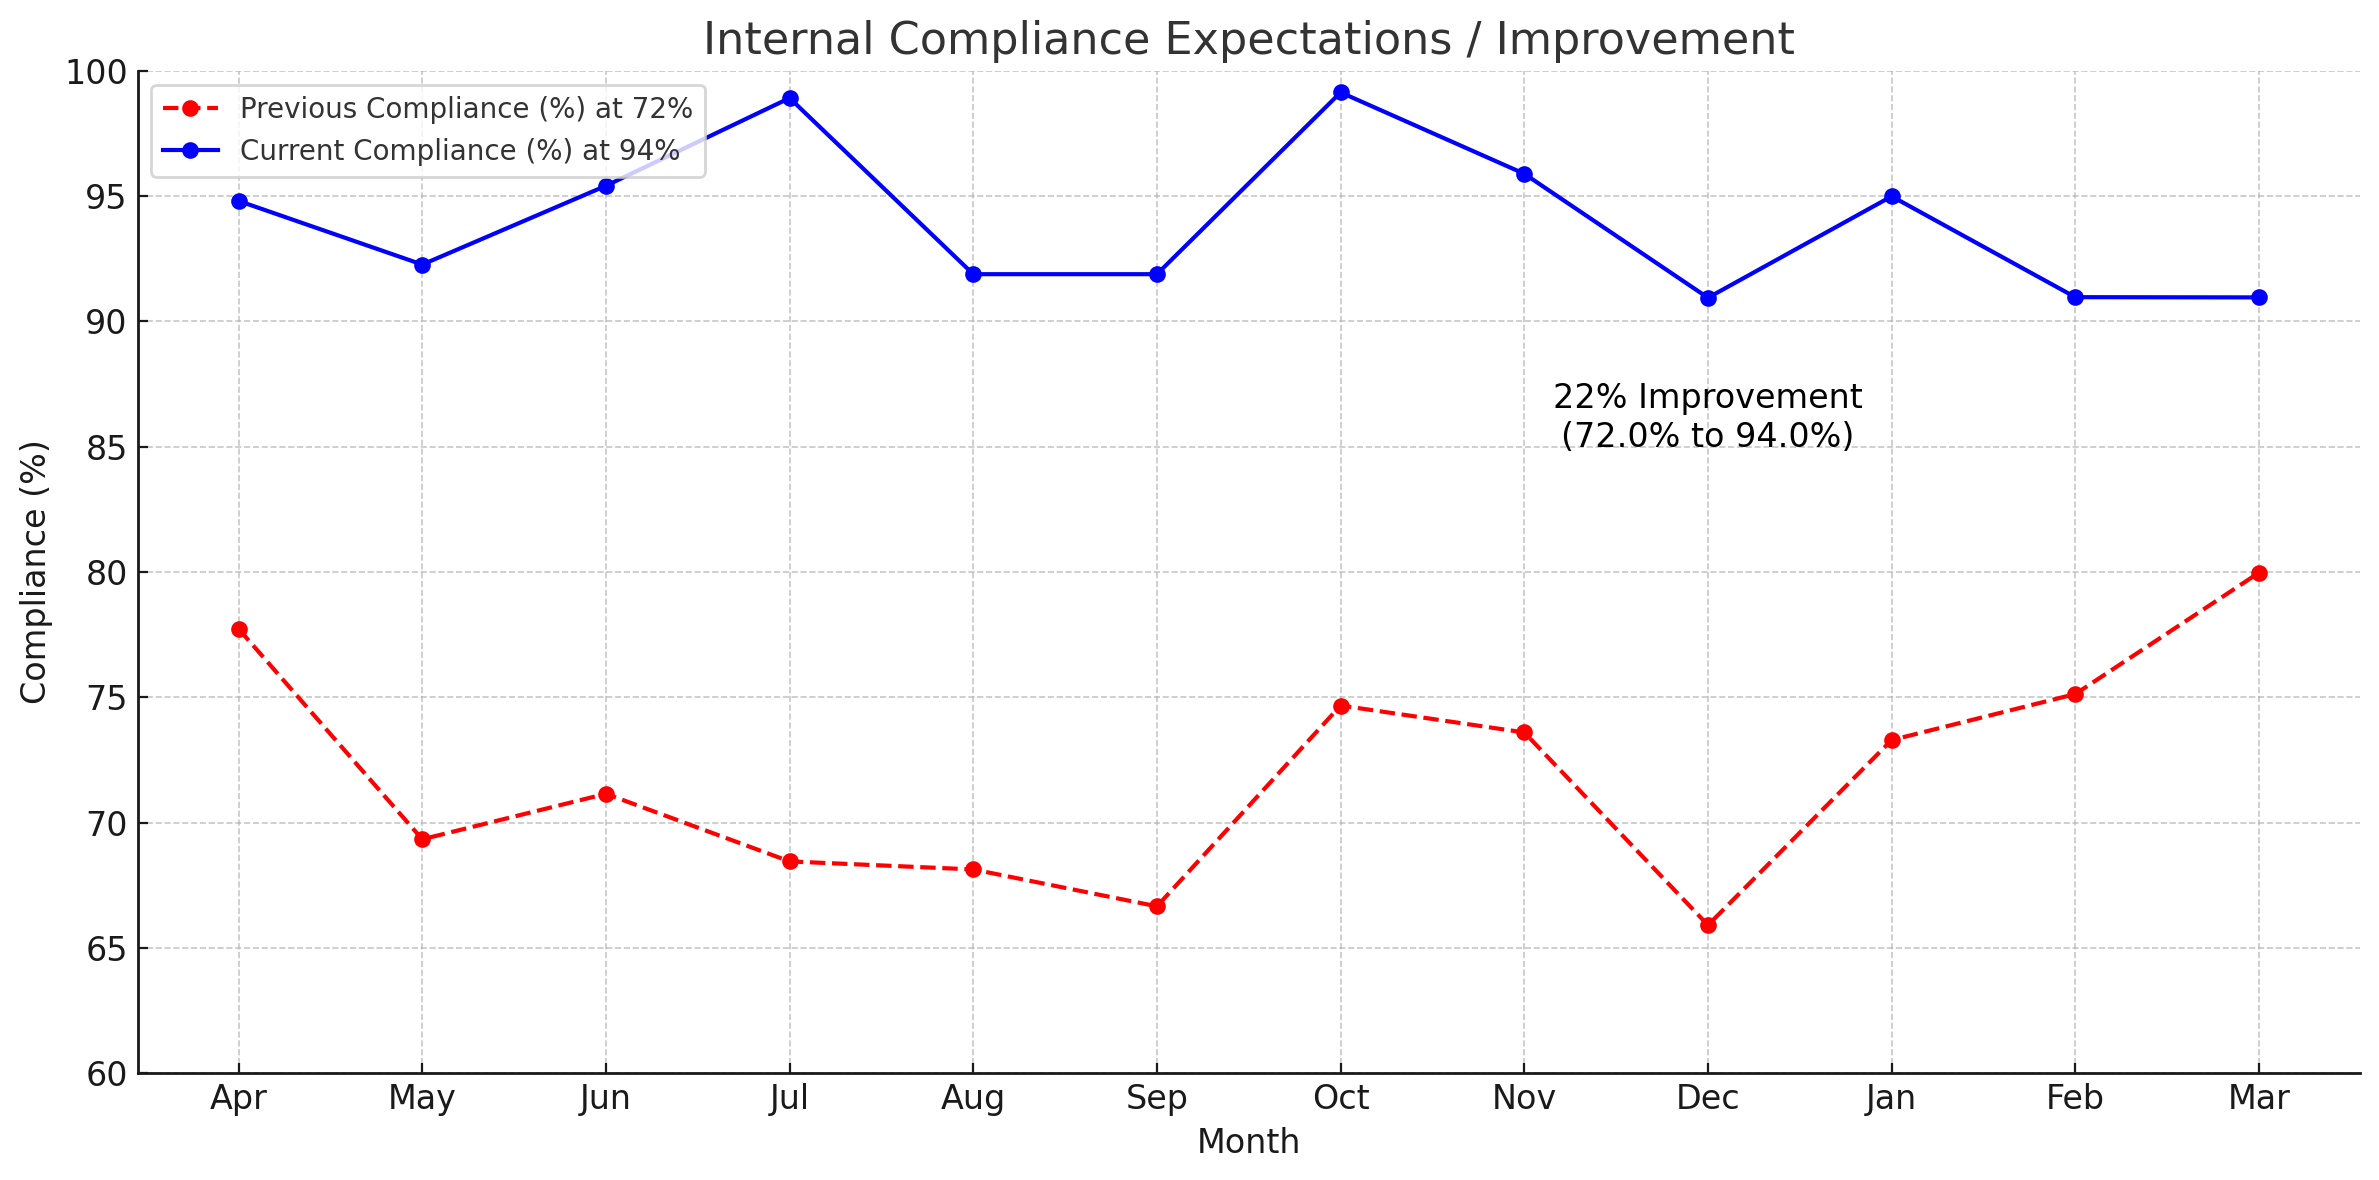
Chart Info:
Comparison of Internal Compliance Over 12 Months:
This line graph shows the compliance rates for the previous 12 months at 72% and the current 12 months with an average of 94%,from April (Apr) to the following March (Mar). The compliance rates for both periods are variable but average to the specified values.
Indication of 22% Improvement:
The chart includes a text annotation highlighting the 22% improvement from the previous average compliance rate of 72% to the current average.
Right sized product lot batches to optimize filling operations, to allow for the completion of filling within the two shift, 16 hour required run time resulting in 11% reduction in bulk discards and an increase in filling yields of 10% for 187 product lots over a 12-monthperiod.
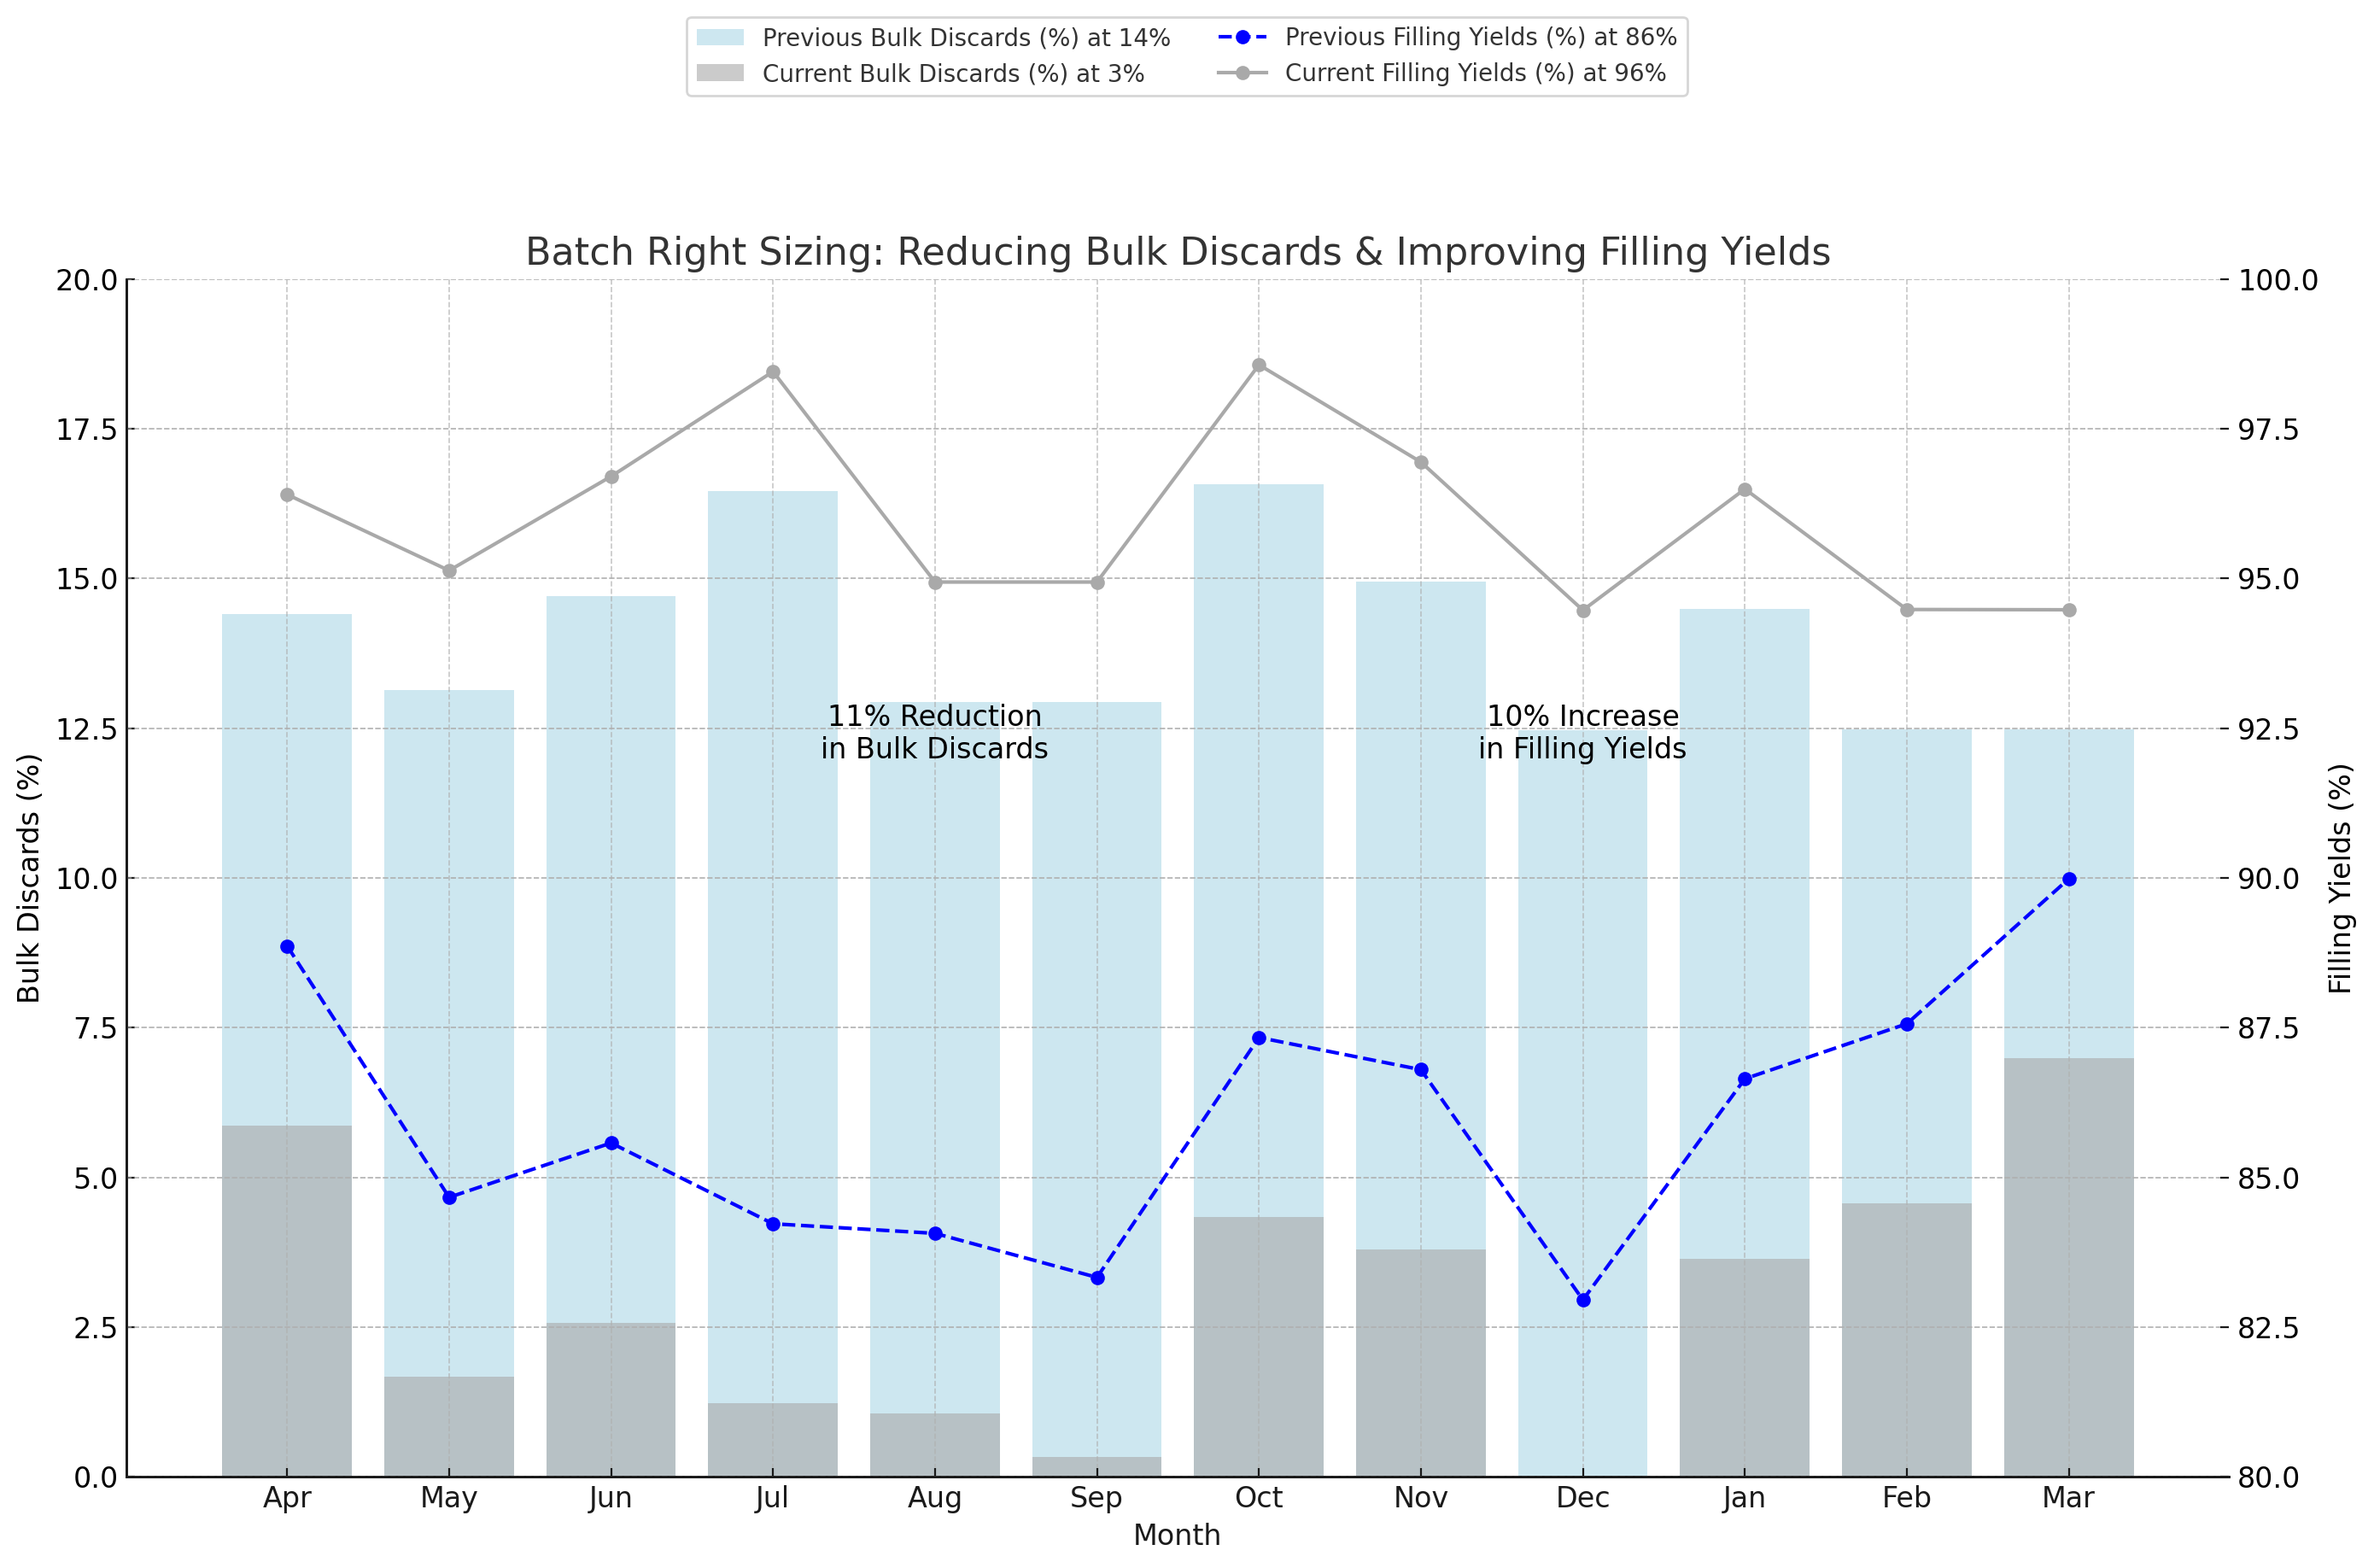
Chart Info:
Adjusted product lot batches to optimize filling operations, to allow for the completionof filling within the two shift, 16 hour required run time resulting in 11%reduction in bulk discards and an increase in filling yields of 10% for 187product lots over a 12-month period.
Bulk Discards:
The bar chart shows the monthly variations in bulk discards for the previous year at 14% (light blue) and the current year at 3% (dark grey).
Filling Yields:
The line graph shows the monthly variations in filling yields for the previous year at 86% (vibrant blue dashed line) and the current year at 96% (dark grey solid line).
Led initiatives to align ARI sites with One DS culture, utilizing the annual Glint survey to gather employee feedback. Implemented focus groups and strategic communication plans, including Connect Listen & Learns (CLL) and townhalls, resulting in numerous process improvements. Conducted joint townhalls with Quality, enhancing information flow and employee engagement. Developed a live One DS roadmap for transparency and management commitment tracking. Achieved a 5% increase in Glint survey participation, rising from 89% in 2023 to 94% in 2024, and an 8% increase in employee engagement from74% to 82%. Enhanced scores across all 30 survey questions, indicating overall cultural improvement.

Chart Info:
Participation and Engagement Rates:
The bar chart compares the participation and engagement rates between January of the previous year (grey bars) and January of the current year (blue bars).
Annotations:
Each bar is annotated with the exact percentage value to clearly show the improvement.
This chart provides a clear comparison of the participation and engagementimprovements, specifically measured in the month of January each year.